Moorhen Tutorial 1: Fix up the Cyclin-Dependent Kinase
Welcome to Moorhen (“Coot on the Web”).
Getting Started
- Open a web browser window and point it at moorhen.org.
Let’s load some data:
- File → Load Tutorial Data … → Tutorial 1 → OK
Moorhen displays a protein model, a blue 2Fo-Fc-style map and an Fo-Fc-style map in green (positive) and red (negative).
-
Use Left-Mouse click and drag to rotate the view. (just click and drag, when using at trackpad)
-
Use scroll-wheel scroll to zoom in and out (use 2-finger drag on a trackpad)
-
Use middle-mouse click to centre on an atom (use Option-click on a trackpad on a Mac)
-
To pan the view, use middle-mouse click and drag (use Shift Option click and drag on a trackpad on a Mac)
You can change the speed that moving the mouse spins the view:
- Preferences → “Mouse Sensitivity” → 0.4 (# for example)
-
Click off the Preferences dialog to make the dialog disappear.
- Similarly, you can change the thickness of the map lines if you wish.
- Use “[” and “]” on the keyboard to adjust the radius of the density.
- Ctrl middle-mouse scroll to change the contour level (one step at time seems good to me).
Let’s Go!
Our job is to fix and amend the protein model in a way that is consistent with the data. Let’s first look at the Ramachandran plot:
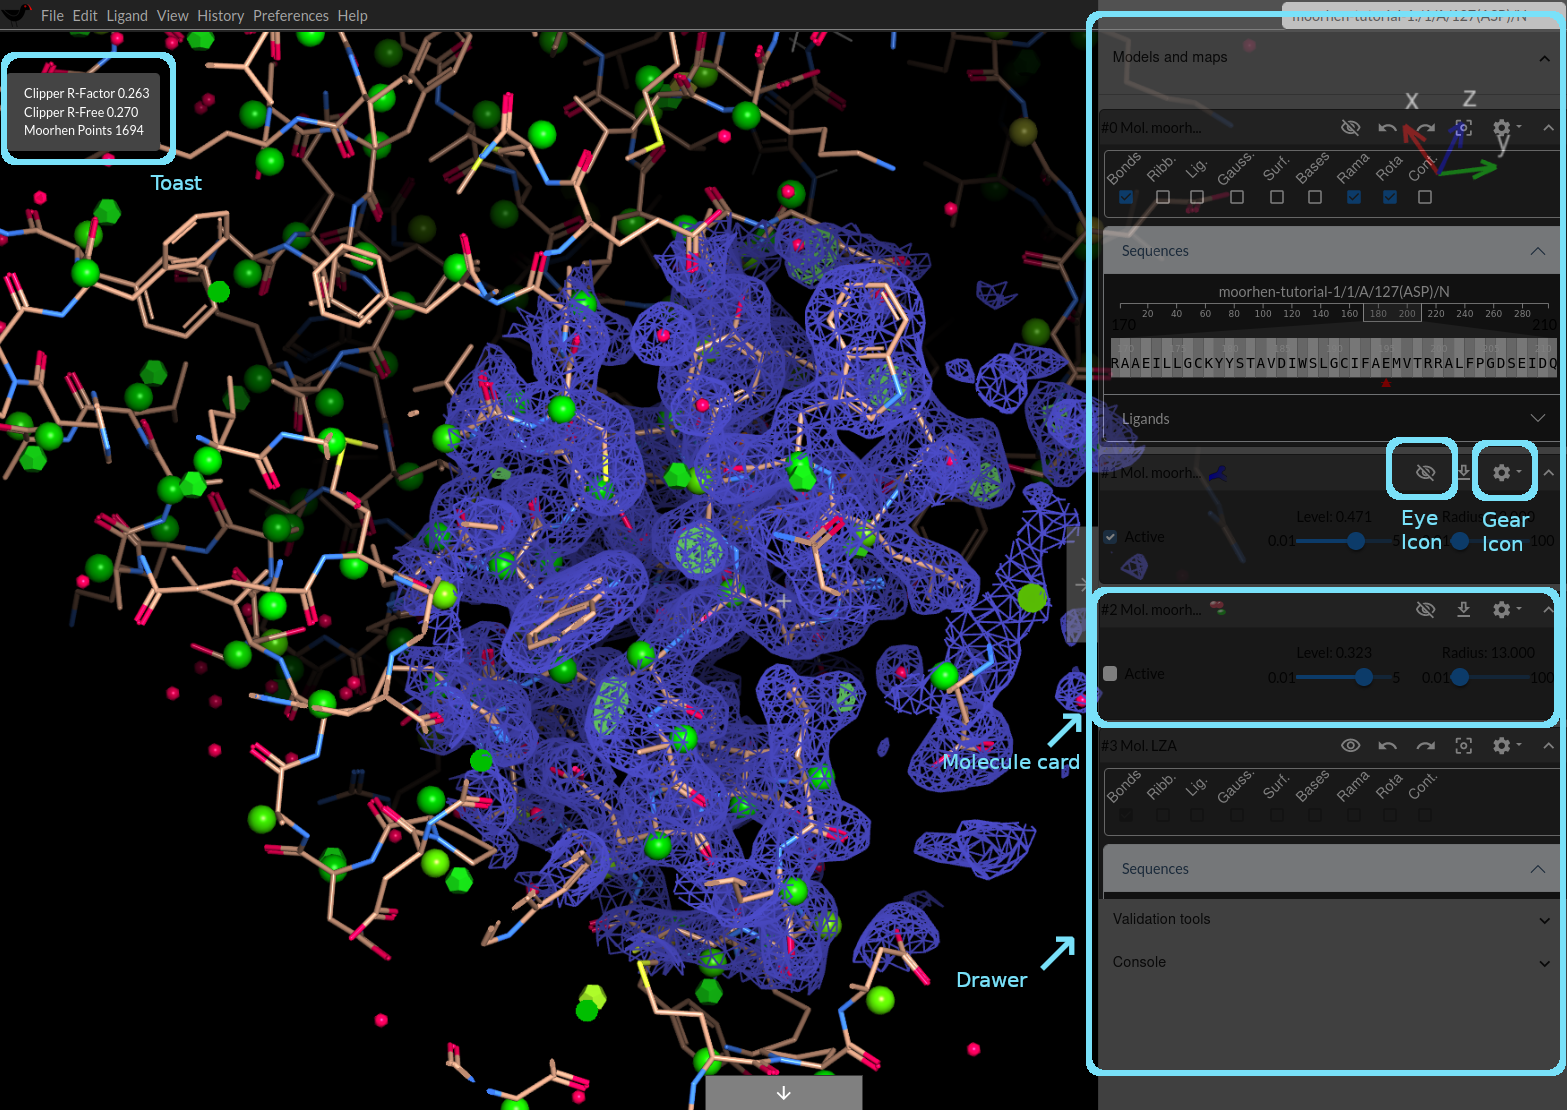
Maps and Models
- Click on the Right side tab
Moorhen display a drawer with “Models and Maps”, “Validation Tools” and “Console”
- Click on the Models and Maps tab
Moorhen expands the tab to display additional information.
Initially the background of the drawer is semi-transparent,
- Put your cursor over the drawer (and the draw will become opaque).
You will see a sequence viewer - let’s use that to move around the structure. Click on a few letters (that represent the residues in the protein). Notice that the map density mesh is redrawn around the new centre.
See the grey rectangle over the sequence numbers?
- Move your cursor inside the box and use left-mouse click and drag to move around the sequence.
You can resize the rectangle to display more residue letters (by clicking and dragging on the edge of the box), but if you make it too wide it will not display any.
- Click on the Ligands tab
Notice that there are “No ligands.” We will add one later.
For higher-end computers we can use a smoother representation of the bonds and atoms.
- [Optional] Click on the gear icon, click on the “Bond Settings” and change the “Smoothness” to Nice.
Below the card for the protein, you will see the cards for the maps (the 2Fo-Fc-style map has a blue icon and the difference map has an icon with red and green). You can use the sliders there to adjust the contour level. It’s a bit high at the moment, so click or slide the slider for the 2Fo-Fc map so that the level is about 0.443 or thereabouts. Set the difference map to a level of around 0.534. (I find that clicking (click and release) on the slider to be monre convenient than trying to “slide” the slider using click and drag).
- Shut the draw and then you can also use Ctrl scroll-wheel scroll to change the contour level
Validation Tools
-
Open the drawer
-
Click on the Validation tools tab
-
Choose Ramachandran Plot in the Tool option menu
Moorhen shows the Ramachandran Plot for the “A” chain of this protein
You will see that there are several interesting red spots.
- Let’s click on the spot at the middle top
Moorhen will put residue A180 at the centre of the screen
Take a look at the region… (You can slide the drawer closed for a better look).
Hmmm… the carbonyl oxygen atoms are a bit close… Are there any other Ramachandran outliers in the area?
-
To measure the distance between atoms, hold M and click on an atom, then (with “M” still pressed) click on another atom.
- In the drawer, click on Models and maps,
- then click on the Rama box for this protein model.
Moorhen displays Ramachandran balls that represent the probability of those phi, psi angles for that residue
Residue A180 has a red ball and just upstream at A178 the LYS has a orange ball. Maybe both of these can be improved.
Notice that there is a green blob close to the N of A180. Maybe it would be better that were fitted by the carbonyl of the peptide. Let’s try that:
Flipping a Peptide
- Along the bottom there is a tool drawer than can be expanded - do so.
Moorhen displays a toolbar with icons for modelling (with which you may already be familiar if you have used Coot)
As you move the mouse over the icons in the toolbar, you will see a tooltip for that icon.
- To flip the peptide you want to use the “Flip Peptide” button. Click it.
A red box appears around the icon to let you know that “Flip Peptide” is the active tool
- Now click on the peptide of A179. Use the Atom Navigator (top right) to find it.
(Moorhen uses transparent golden balls to let you know which will be the picked atom or residue when you left-click to pick it.)
Moorhen flips the Peptide and the Ramachandran ball for that residues turns green
Yay. Progress. Let’s see if we can do the same for residue A178.
- Click on the “Flip Peptide” button again and click on the carbonyl oxygen atom of A177.
Moorhen flips the peptide and the Ramachandran ball for 177 turrns green
More progress. Good stuff.
- Look at the Ramachandran Plot in the draw. Notice that the red spots for the problematic residues have disappeared.
Navigation tip: Use the middle mouse button click over an atom to put the centre of the residue at the centre of the screen. Use Alt left mouse to put the clicked atom at the centre of the screen.
Real Space Refinement
- Click on the “Refine Residues” button and choose “Sphere” in the option menu. Click on an atom in residue A178.
Moorhen refines the sphere of residues
Now the local backbone fits quite nicely into the blue map.
Connect the Maps: Updating Maps
Wouldn’t it be nice though, if the difference map updated, so that if you add atoms to green blobs or removed them from red blobs then those blobs would disappear?
Let’s try that:
- File → Connect molecule and map for updating… → OK. (No need to change the values in the options menus because they are already setup to be correct.)
Moorhen will display a “toast” top left informing you of the current R-factor and the number of Moorhen points that you have collected (so far none, because we have just started)
Note: Using updating/connected maps will slow down the model-building process somewhat but we now have the advantage of collection Moorhen points and watching the R-factor go down as we make changes. Moorhen points indicate progress in flattening the difference map.
Difference Map Peaks
In the drawer, the currently active tool in the Validation option menu is the Ramachandran Plot
- Let’s change that to Difference Map Peaks.
Moorhen displays the difference map peaks in a waterfall plot
- Use the slider to change the RMSD to about 5.0.
On the left of the waterfall plot are the most positive peaks (and if there were any the most negative peaks would be displayed on the far right).
- Here I find it useful to adjust the contour level to 0.64 (and 0.47 for the difference map).
- Let’s open the Validation Tools card again and click on the biggest/leftmost peak.
What are we looking at? An orange Ramachandran ball?
Flipping… flipping
It’s a flipped peptide.
- So let’s flip it to the correct orientation.
As we do so, Moorhen makes several updates. It moves the model, it updates the maps in the light of the new model, it updates the Ramachandran balls so that they are both green now. And, in the toast, it updates the R-factor (a tiny amount) and gives us some Moorhen points.
Flipping a peptide to the correct orientation generally gives you 15-20 Moorhen points.
Have a look around… At the end of the helix, residues A198 has an orange Ramachandran ball and a green difference map peak along the peptide. Let’s flip that too while we are here.
- Click the “Flip Peptide” button and pick the “C” atom of A197. You can use the key-bding “Shift Q” to flip the peptide when you hover of an atom of the residue and see golden balls.
As before, the Rama balls update, the maps update (the green blob disappears), the R-factor updates and we get more Moorhen points.
You will notice that that the Difference Map Peaks graph has been updated too - the leftmost peak has gone. Have a look at the next 12 or so peaks. What do you notice?
Adding Waters
You will notice that they are mostly peaks of waters. We could add waters one by one, but a more automated method is to do many at the same time.
- Ligand → Add waters… → OK
This will add around 100 waters. And as above, the maps and the R-factors will update and we will get many Moorhen points. The map should improve a bit so that the ligand is more easy to make out.
Contact Dots and Clashes
- Use the sequence viewer to navigate to residue A194.
What this? It’s a flipped peptide - let’s flip it back to where it should be. But having done that, what do you notice? Let’s use Moorhen’s clash analysis:
- In the model molecule card for the tutorial structure you will see a box labelled Cont. - click it.
Moorhen display contact dots and clash interactions
Wooh! Pink sticks. Bad news! So let’s also flip the pepide on the next rung of the helix - residue A197.
The contact dots between A194 and A197 disappear
- OK, you can turn off the contact dots for now by unclicking the Cont. box in the molecule card.
Change the Residue Type
Now navigate to residues A193. What do the maps tell you is going on here? What is the residue type? What does the model say? What does the map say?
OK, so first let’s fill the side-chain with the atoms of the type from the main-chain atoms: “TYR” - in the lower toolbar, click on “Auto-fit Rotamer” and then click on an atom in residue A193.
What do we see? What does that suggest?
It suggests that the sequence of the model doesn’t match the sequence of the protein from which the data were collected. OK, so let’s mutate it.
- In the lower toolbar, click on the “Simple Mutate” button, then from the residues type chooser currently “ALA (A)” choose “PHE (F)” then click on an atom in residue A193.
Moorhen updates the map so that the red blob goes away
- Navigate to residue A168.
What do we see? What should it be instead?
Mutate
OK, so let’s mutate it:
- Use “Simple Mutate”, change the type to “TYR (Y”) and click on an atom in the residues A169.
(More Moorhen Points - yay).
- Let’s go back to the Difference Map Peaks in the Validation tools
Now you can see negative peaks. Let’s have a look at those.
Can you find a negative difference map peak that is close to resiude A187? Have a look at the model? What needs to be changed?
Rotamers
In the drawer, in the card for the protein molecule, click the box for “Rota”
Moorhen displays rotamer dodecamers coloured by rotamer probability
- So let’s change the rotamer using the “Auto-fit Rotamer” button. Then click on atom in A187.
- If the side-chain doesn’t lie flat in its density, you can use the target button “Refine Residues” adn then click on the atom in A187 to give it a bit of Real Space Refinement that will sort of the fitting.
On improvement of the rotamer probability, Moorhen will change the colour of the dodecahedron to be more green
Can you find a negative difference map peak close to residue A141? Again examine. What do we need to do? Let’s fix the rotamer then using “Auto-fit Rotamer” as before.
Fit the Ligand
OK, now it’s time to fit the ligand!
- Use the Difference Map Peaks to navigate to the ligand.
Several of the top 5 peaks should now correspond to the ligand.
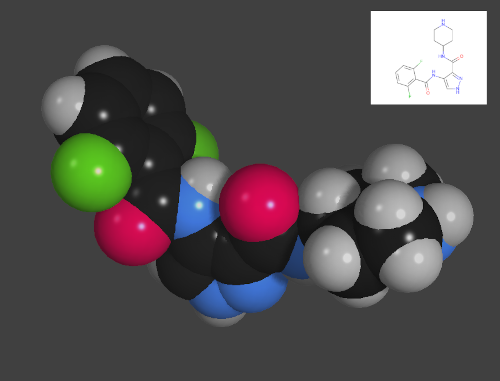
- Ligand → Get Monomer → LZA → OK
Moorhen imports the LZA ligand
OK, fine. Now let’s undisplay it:
- In the drawer, the bottom card should now be the card for the newly imported ligand (“#3 Mol LZA”). Click on the eye icon to undisplay the ligand
Moorhen changes the icon to an uncrossed eye and the ligand disappears
-
Ligand → Fit ligand here…
-
Change the option menu labelled “Ligand molecule” so that it reads “3: LZA” then click OK.
Moorhen fits the ligand in the local blob
It should be reasonably close but not exact because the algorithm didn’t use conformational variation.
Merge the Ligand
So let’s add the ligand to the protein model:
- Edit → Merge molecules…
- Change the entry in the option menu labelled “From molecule” so that it reads “4: lig_4”
- Click OK.
Moorhen updates the maps so that the difference map blobs change
Now let’s refine the ligand and the surrounding residues:
- In the lower toolbar, click “Refine Residues”, change the option menu to “SPHERE” then click on an atom in the ligand
Moorhen updates the maps so that there are no difference maps peaks left on the ligand
Add a Water
- Navigate to a water peak using middle-mouse click and drag (or Shift-Alt Left-Mouse on a PC) to drag the view to the water blob.
- You can also use the arrow-keys to pan the view
Let’s add a water here
- In the bottom toolbar, click on the Add simple button
- Change the option menu to read “HOH”
Moorhen adds a water at the centre of the screen
There are several water peaks in the map similar to this.
At some stage, when you add a water, you will see a the contours of negative density over part or all the water peak. What does that mean?
## More Validation Tools
- Open the drawer
- Click on Validation Tools
- Click on Validation Plot
Moorhen displays interactive validation graphs.
Over to You!
- Click on the validation bars to navigate to interesting parts of the structure and make some fixes.
You should be able to collect about 1800 Moorhen points. Maybe more!
Make a Pretty Picture
- Using the cards in the drawer, undisplay the maps using the eye icon
- Click on “Bonds” to undisplay the “Bonds” representation of the model
- Likewise undisplay the Rama ball and Rota dodecs if you have the displayed
- Click on Lig. to display the ligand in the model
- Click on Ribb. to display the model in Ribbon mode
To navigate to the ligand:
- Ligand → Centre on ligand…
- Click “+”
- Click the “/1/A/1(LZA)” label
- View → Set background colour - change it if you wish
- View → Clipping and fogging…
- Adjust the sliders to make the ligand more clearly visible
- OK
Use keyboard “S” to activate the “in application” screen capture.
Export Your Molecule
- In the drawer, in the card for the model molecule, click the gear icon
- and choose “Download molecule”
Then it’s time to think about Reciprocal Space Refinement.
Notes:
The tutorial is based on 2vtq “Identification of N-(4-piperidinyl)-4-(2,6-dichlorobenzoylamino)-1H- pyrazole-3-carboxamide (AT7519), a Novel Cyclin Dependent Kinase Inhibitor Using Fragment-Based X-Ray Crystallography and Structure Based Drug Design” Wyatt, P.G. et al. (2008), J. Med. Chem. 51, 4986.